Cincinnati population statistics offer a clear snapshot of how people live, age, and form households across the city.
Demographic patterns shape housing demand, workforce trends, school enrollment, and neighborhood growth, making population data essential for planners, businesses, and residents alike.
Race and ethnicity figures show how communities are distributed and how representation shifts across different parts of the city.
Patterns emerge that reflect historical settlement, migration, and economic opportunity, influencing everything from local services to voting districts. Age distribution adds another layer by showing how residents move through different life stages.
Population data reveals concentrations that affect schools, healthcare access, and employment pipelines, including:
- Younger age groups tied closely to universities and entry-level job markets
- Working-age adults driving household formation and economic activity
- Older residents shaping demand for healthcare and age-focused services
Of course, having a proper understanding of the city’s population trends paints a solid picture of what can be expected in the future.
Let’s talk about it.
Population Overview
| Item | Value |
|---|---|
| Estimated population | 314,915 |
| Census population in 2020 | 309,317 |
| Population growth (2020-present) | 1.7% |
| Population density | 3,974 residents per square mile |
Cincinnati reached an estimated population of 314,915 in 2025 according to Census.org, continuing a pattern of gradual growth established after the 2020 census count of 309,317.
Population change across recent years reflects sustained residential demand tied to employment availability, institutional anchors, and stable housing supply.
Net growth of 1.7% across the 4 years points to incremental expansion rather than sharp demographic shifts, reinforcing a profile marked by continuity and measured change.
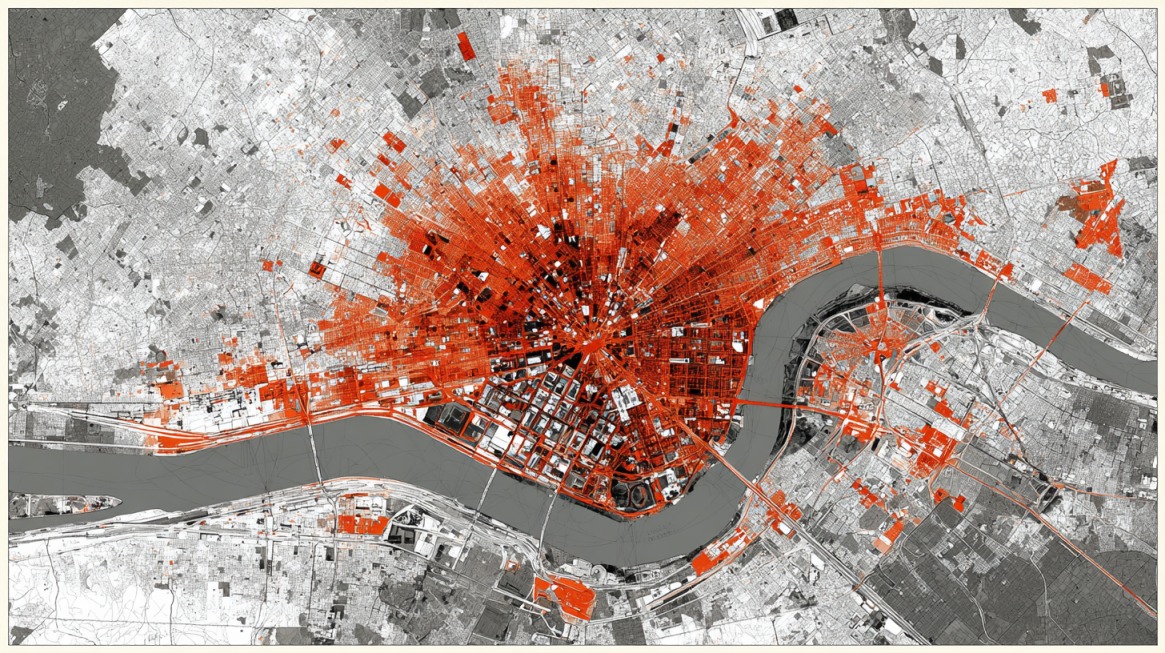
Population density measured 3,974 residents per square mile using 2020 figures. Such density reinforces a compact urban settlement structure that affects zoning decisions, transportation networks, emergency response coverage, and access to public amenities.
Concentration of residents within defined boundaries shapes service delivery efficiency while also influencing housing competition and infrastructure maintenance needs.
- Women account for 51.9% of residents
- Men represent 48.1%.
Such a balance supports broad labor participation across sectors while also influencing household caregiving roles, healthcare utilization patterns, and community service demand.
Foreign-born residents represent 7.1% of the total population.
The presence of international residents contributes to labor supply, small business formation, multilingual households, and community institutions that support cultural continuity and workforce integration across multiple neighborhoods.
Age Distribution
Age structure demonstrates balance across early childhood, working-age adulthood, and senior years. Children under age five account for 6.3% of residents, signaling steady early childhood population levels that sustain demand for childcare services and early education facilities.
Individuals under age eighteen represent 20.8%, reinforcing long-term demand for primary and secondary education, youth services, and family-oriented housing.
Working-age adults between eighteen and sixty-four comprise approximately 66%of the population.
Such representation forms the core labor force and consumer base, supporting employment activity, housing demand, and municipal revenue generation.
Residents aged sixty-five and older account for 13.2%, reflecting a growing senior segment with specific healthcare, mobility, and housing needs.
Gradual population aging occurs alongside sustained working-age representation. Such alignment supports labor continuity while increasing demand for healthcare services, accessible transportation options, and age-appropriate residential development.
Racial and Ethnic Composition
Racial composition reflects closely proportioned population groups across the city. White residents identifying alone account for 46.9% of the population.
Black or African American residents identifying alone represent 38.7%, forming a substantial share of residential, cultural, and economic activity. Asian residents account for 2.8%, while individuals identifying with two or more races represent 7.0%.
American Indian and Alaska Native residents account for 0.1%.
Population distribution across racial and ethnic groups influences neighborhood development patterns, public service allocation, school enrollment trends, and civic participation.
Representation across multiple groups contributes to varied household structures and service needs across city districts.

Household and Family Characteristics
Household composition reflects a predominance of smaller living arrangements combined with renter-dominated occupancy. Average household estimates during the 2019 to 2023 period total 142,810 households.
Average household size measures 2.07 persons, indicating the prevalence of single-person households, couples without children, and compact family units.
Owner-occupied housing represents 38.9% of residences, confirming a majority renter population that affects housing stability, affordability pressures, and neighborhood turnover.
- Residential stability shows 79.6% of residents lived in the same home one year earlier
- Households using a language other than English account for 9.4%
Housing tenure patterns and language use trends shape neighborhood continuity, school communication strategies, and access to public information across municipal systems.
Education Levels
Educational attainment among adult residents remains strong and consistent across multiple credential levels.
Individuals aged twenty-five and older holding a high school diploma or higher account for 89.7% of the population, indicating broad access to foundational education and completion rates that support employability across a wide range of occupations.
Such attainment contributes to baseline workforce readiness and supports adaptability within changing labor markets.
Bachelor’s degree attainment or higher reaches 41.3% among adults aged twenty-five and older. The presence of advanced credentials supports employment within professional, administrative, healthcare, education, and management roles.
The concentration of degree holders also strengthens institutional capacity across hospitals, universities, public agencies, and private employers.
- High school completion or higher equals 89.7%
- Bachelor’s degree or higher equals 41.3%
Education outcomes reinforce workforce preparedness and long-term economic potential.
Income measures, however, indicate uneven financial returns across credential levels, suggesting structural factors affecting wage growth, occupational segmentation, and advancement opportunities.
Income and Poverty
Median household income measured in 2023 dollars reached $51,707, reflecting combined earnings across households with varying sizes, employment structures, and dependency levels.
Income at this level places many households near affordability thresholds tied to housing costs, utilities, transportation, and healthcare expenses, particularly within renter-dominated areas of the city.
Per capita income totaled $38,878, offering insight into individual earning capacity across working and non-working residents. Per capita figures reveal the presence of income variation tied to part-time employment, wage disparities across sectors, and differences in access to higher-paying professional roles.
Despite relatively high educational attainment across adult residents, poverty affects 24.5% of the population. Such prevalence indicates sustained economic strain affecting a substantial share of households, including working families, single-adult households, and residents dependent on fixed or variable incomes.
Poverty rates at this level place continued pressure on social services, housing assistance programs, and public health systems.
Income patterns reveal a disconnect between education levels and earnings outcomes. Degree attainment does not consistently translate into proportional wage growth for all residents.
Structural factors contributing to this gap include occupational segmentation, limited upward mobility in service-based industries, wage compression, and rising living costs.
Affordability pressures tied to housing, healthcare, transportation, childcare, and essential goods continue to shape household financial stability and long-term economic security.
Employment and Economic Sectors

Labor force participation among residents aged sixteen and older measures 65.8%, indicating consistent engagement in employment or job-seeking activity.
Female labor force participation stands at 63.0%, supporting overall workforce inclusion and contributing to household income stability across sectors.
Employment activity centers heavily within service-oriented industries, shaping wage patterns, scheduling structures, and job availability.
- Healthcare and social assistance generated $9.9 billion in 2022
- Retail trade produced $4.5 billion
- Transportation and warehousing generated $2.0 billion
- Accommodation and food services produced $1.2 billion
Industry concentration affects labor demand, skill requirements, and income distribution. Healthcare remains a primary economic driver, while retail and logistics support broad employment access across education levels.
Average commute time measures 23.1 minutes, reflecting moderate travel distances between residential areas and employment centers. Commute duration influences transportation planning priorities, workforce accessibility, and daily time allocation tied to work-life balance.
Summary
Population data presents a very rich county shaped by stability rather than volatility. Moderate growth since 2020 signals sustained residential demand without the pressures associated with rapid expansion.
Demographic structure supports a steady labor force, with a large working-age population complemented by rising educational attainment. Strong completion rates at both secondary and postsecondary levels provide a solid foundation for economic participation.
At the same time, income and poverty figures reveal that educational credentials alone do not guarantee financial security for many residents, underscoring gaps between labor supply qualifications and wage outcomes.
References:
- Census.org – Quick facts, Cincinnati City, Ohio
- censusdots.com – Cincinnati, Ohio demographics
- worldpopulationreview.com – Cincinnati