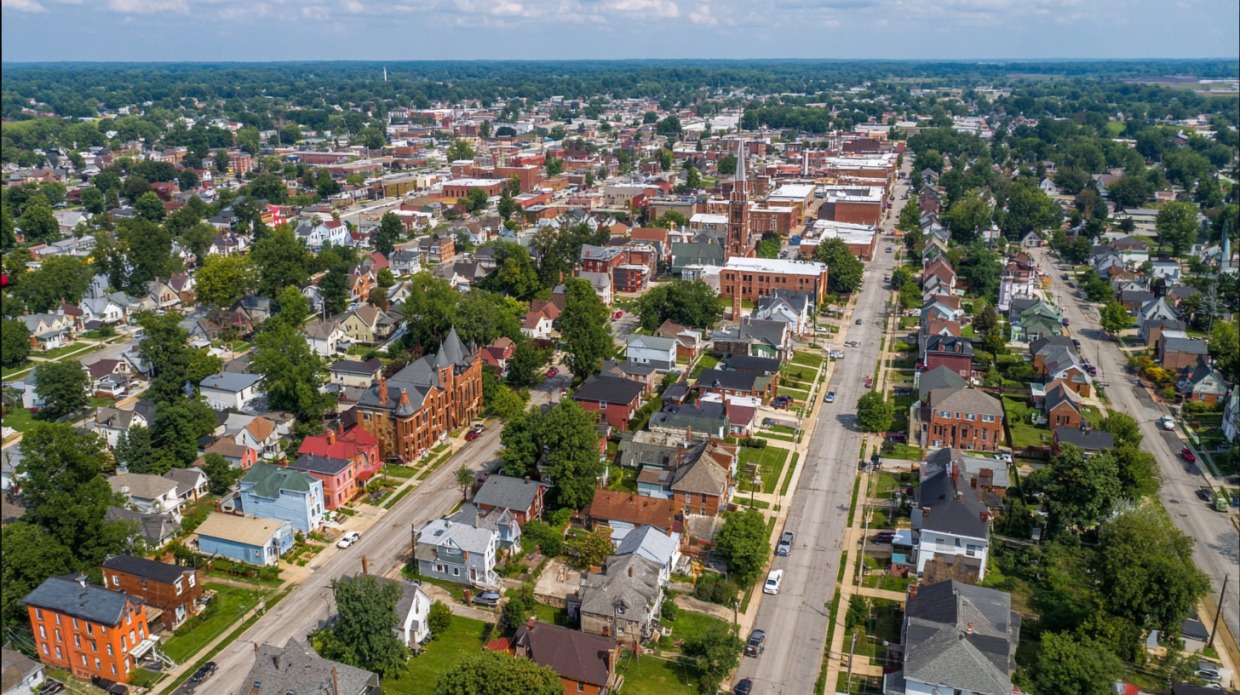
Lima sits in Allen County as a small urban center serving northwestern Ohio with a population shaped by steady, long-term change.
Demographic patterns point to gradual population shifts, changing household structures, and sustained economic pressure that influence daily life across the city.
Population size, age distribution, racial composition, income levels, and family structure interact to shape housing demand, workforce needs, and public services.
Careful evaluation of these elements supports informed decision-making for municipal leaders, employers, and community organizations working to address current conditions and future needs.
Current Population Overview
Population size in Lima reflects modest movement rather than sharp expansion or contraction. According to WorldPopulationReview, estimates place the 2025 population at 34,690.
Such close alignment between consecutive years suggests a stable base population with limited short-term volatility.
Another widely cited estimate places the population higher at 36,908 residents. Variation across estimates likely results from differences in geographic scope, boundary definitions, or statistical methodology.
Despite these differences, all figures position Lima within a consistent population range that defines its scale among Ohio cities.
City size ranking places Lima as the 43rd most populous municipality among 1,264 cities statewide, reinforcing its position as a mid-sized urban center serving a broader regional role.
Recent annual change supports a gradual downward pattern rather than accelerated loss, with data showing a decline of approximately 0.2% between 2023 and 2024.
- 34,690 residents estimated for 2024
- 34,635 residents projected for 2025
- 43rd statewide ranking by population size
Population stability across short time spans contrasts with longer-term decline, indicating resilience alongside demographic pressure.
What Are the Population Trends?
Longer-term population patterns show that Lima reached its highest levels during the 2016 to 2018 period. Population counts following that period began to edge downward, with the 2020 Census confirming a lower count than earlier projections had suggested.
Census verification marked a reset in expectations rather than a sudden shift.
Despite this adjustment, population totals have remained within the mid 30,000 range across most of the past decade. Year-to-year change has remained limited, avoiding dramatic increases or steep losses.
Stability plays a defining role in recent demographic behavior, even as incremental decline persists.
- Peak population occurred before 2019
- Census data in 2020 confirmed a lower baseline
- De-long population range remained largely consistent
Slow decline paired with minimal fluctuation points to a city maintaining its core population while navigating long-term demographic challenges.
Age and Gender Breakdown

Age structure in Lima skews younger than state and national norms. Median age estimates range between 33.5 and 35.4 years, indicating a substantial working-age population supported by a notable share of children.
Such age distribution influences labor availability, school enrollment, and demand for family-focused services.
Gender balance remains slightly weighted toward males, with approximately 1.1 males recorded for every female. Household composition further reflects life stage patterns tied to age and gender. Marriage and child presence remain central features within the population.
- 38% of residents age 15 and older are married
- 53% of families include children under 18
Household structure tied to these patterns suggests continued demand for employment opportunities, education services, and community support programs aimed at younger families.
Race and Ethnicity

Racial composition shows a population primarily identifying as White, accounting for roughly 64% of residents, while Black or African American residents represent the second largest group at approximately 23 to 25%.
The remaining population shares identify with several smaller racial categories that collectively shape community composition.
- 8.4% identify with two or more races
- 4.7% identify as Hispanic or Latino of any race
- Asian residents account for about 0.15%
- American Indian residents represent about 0.10%
Language use patterns show strong dominance of English, with 96% of residents speaking only English at home.
Spanish-only speakers account for 2%, while foreign-born residents represent approximately 1.4% of the total population.
Linguistic patterns suggest limited communication barriers across most households.
Income and Economic Status

Economic conditions in Lima reflect modest earnings paired with a visible income imbalance that shapes daily life for many residents.
Median household income is estimated at 43,370 dollars based on recent survey reporting, placing the city below statewide income averages. Earnings at this level influence spending power, housing options, and access to long-term financial security for a large share of households.
Comparison with nearby communities such as Seaman and Bannock shows slightly higher income levels in Lima, yet the difference remains narrow. Relative positioning suggests regional consistency rather than a strong economic advantage.
Wage levels and employment opportunities appear sufficient to maintain baseline stability, though limited upward income mobility remains a concern.
Income distribution reveals a strong concentration toward lower earning brackets, which affects overall economic resilience.
- 37% of households earn less than $25,000 annually
- Only 3% earn more than $150,000
Such an imbalance places pressure on public assistance programs, housing affordability, and workforce development initiatives. Middle-income households face limited buffer against economic disruption, while lower-income households often experience heightened vulnerability during periods of rising costs.
Poverty remains a central economic issue across the city. Approximately 21.2 percent of families live below the poverty line, affecting long-term outcomes tied to health, education, and housing stability.
Persistent poverty levels influence neighborhood conditions and contribute to uneven access to resources, reinforcing economic challenges across multiple generations.
Family and Household Structure
@laneyintheland I love and appreciate Lima, my fav ghetto cornfield, but this song is absolutely not the vibe. #ohio #laneyinohio #morganwallen #hometown #419 ♬ More Than My Hometown – Morgan Wallen
Household composition in Lima reflects a mix of traditional and non-traditional arrangements.
Marriage remains common among adults, with 38% of individuals aged 15 and older reported as married.
Family households frequently include children, as 53% report residents under age 18, which is higher than the federal level, which is 39%.
- Married couple families
- Single parent households
- Non-family households composed of unrelated individuals
Varied household types influence housing demand, neighborhood composition, and planning priorities tied to education, childcare, and social services across the community.
Closing Thoughts
Population patterns show relative stability paired with a gradual decline.
Younger median age levels and a high share of households with children shape service demand across education and community programs.
Economic conditions reflect modest income levels and elevated poverty rates compared to state averages.
Demographic and economic characteristics together define ongoing challenges and opportunities for planning, public services, and economic growth initiatives in Lima.
References:
- WorldPopulationReview – Lima, Ohio Population 2025
- Census.gov – Lima, Ohio
- PolicyMattersOhio – Rebalance the income tax to build a better Ohio for everyone
- Census.gov – Four in Five Family Households With a Householder Ages 35-39 Included a Child Under 18 in 2024