Ohio presents a striking contrast in economic conditions, with some areas experiencing prosperity while others face severe hardship.
A closer examination of specific Zip Codes reveals communities grappling with high poverty rates and low incomes.
The idea becomes much clearer when these are then compared with the richest counties and cities in the state.
Through analyzing both urban and rural areas, it becomes clear that financial struggles are not confined to one type of setting.
Identifying these locations is essential for understanding the distribution of poverty and recognizing where assistance is most urgently required.
Let us talk about it.
Top 10 Poorest ZIP Codes in Ohio by Poverty Rate
| ZIP Code | City | Poverty Rate (%) |
|---|---|---|
| 45204 | Cincinnati | 68.7 |
| 44115 | Cleveland | 65.1 |
| 43604 | Toledo | 58.2 |
| 45225 | Cincinnati | 54.3 |
| 45214 | Cincinnati | 51.5 |
| 44104 | Cleveland | 49.6 |
| 45203 | Cincinnati | 48.8 |
| 44114 | Cleveland | 48.5 |
| 44702 | Canton | 45.5 |
| 45232 | Cincinnati | 44.6 |
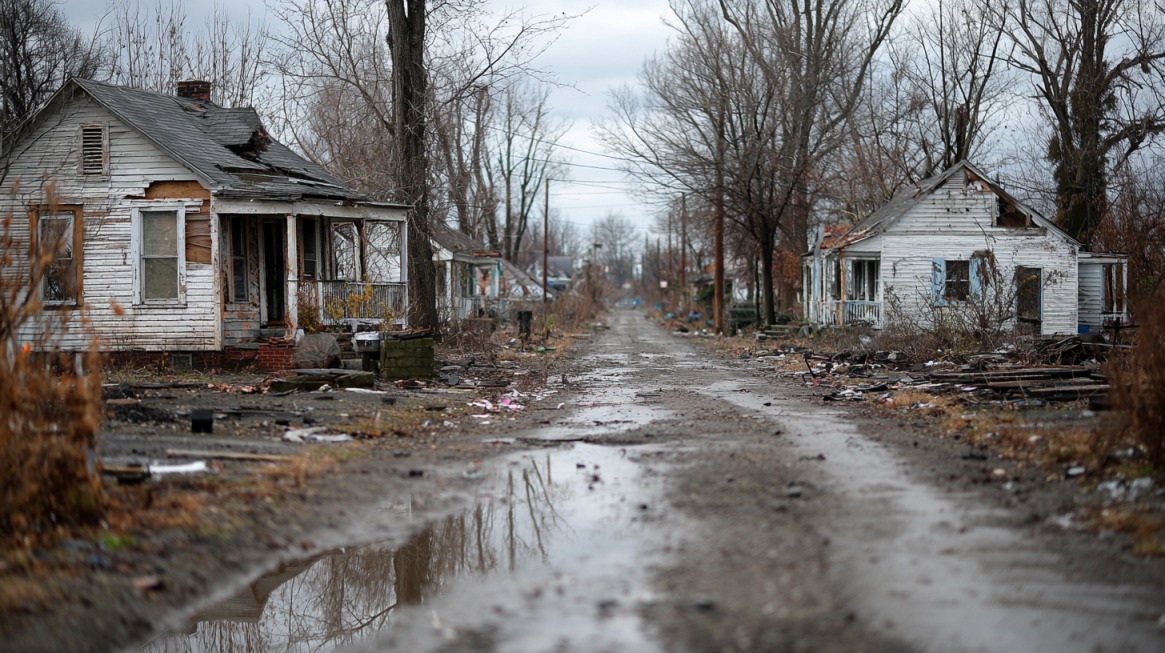
Economic hardship is concentrated in specific Ohio Zip Codes, where residents face long-term financial struggles, limited job opportunities, and barriers to economic mobility.
The challenges vary between urban neighborhoods that were once industrial powerhouses and rural towns that have faced population decline for decades.
Examining both poverty rates and Adjusted Gross Income (AGI) provides a more comprehensive picture of these communities.
45204 – Cincinnati: 68.7%

Located along Cincinnati’s western corridor, this ZIP covers neighborhoods with a history rooted in manufacturing.
Industrial decline left many without stable employment, forcing a shift to low-wage service positions.
Limited access to affordable healthcare and quality education compounds the challenges faced by residents.
- Decline in manufacturing employment
- High reliance on low-wage service jobs
- Limited access to healthcare and quality schools
44115 – Cleveland: 65.1%
Positioned near the city’s industrial core, this area has experienced long-term disinvestment.
Vacant warehouses dominate portions of the neighborhood, and housing units often remain unoccupied or in disrepair.
Residents frequently travel outside the ZIP for groceries and basic services.
- High property vacancy rates
- Scarcity of grocery stores and essential services
- Ongoing industrial decline is impacting job availability
43604 – Toledo: 58.2%
Covering sections of downtown Toledo, this ZIP shows a visible divide between revitalized commercial spaces and nearby struggling neighborhoods.
While new businesses open, wages remain stagnant for many residents.
- Income disparity between business districts and neighborhoods
- Presence of new developments without wage growth
- Housing instability in certain residential blocks
45225 – Cincinnati: 54.3%
A historically working-class community, this ZIP has endured long-term job losses that have slowed recovery.
Although affordable housing exists, infrastructure requires significant upgrades, and investment is limited.
- Job losses affecting the manufacturing and trade sectors
- Aging infrastructure in need of repairs
- Low levels of private and public investment
45214 – Cincinnati: 51.5%
Once a hub for industrial employment, this area has been reshaped by high unemployment, declining school funding, and insufficient public transportation.
These conditions hinder residents’ access to higher-paying jobs outside the neighborhood.
- High unemployment rates
- Underfunded public schools
- Inadequate public transportation services
44104 – Cleveland: 49.6%

Depopulation has left this ZIP with numerous vacant lots and a diminished business presence.
Employment opportunities within the neighborhood are limited, and many residents rely on public assistance to make ends meet.
- Significant population decline
- Limited commercial activity
- Heavy dependence on low-income support programs
45203 – Cincinnati: 48.8%
Despite being close to downtown, this area remains economically disconnected from surrounding development.
Residents face rising living costs that outpace income growth.
- Proximity to business centers without economic integration
- Rising rental and living costs
- Wage stagnation for existing jobs
44114 – Cleveland: 48.5%
This ZIP combines corporate presence with neighborhoods experiencing financial hardship.
Affordable housing is scarce, and many low-income households face pressure from increasing costs.
- Coexistence of wealth and poverty within the same area
- Limited availability of affordable housing
- Cost of living increases impacting residents
44702 – Canton: 45.5%
Canton’s historic core, once thriving with industry, now faces a declining population and shrinking tax revenues.
These changes limit the resources available for public services and infrastructure maintenance.
- Reduction in industrial employment
- An aging population with limited income sources
- Declining municipal funding for community projects
45232 – Cincinnati: 44.6%
A combination of residential and industrial land use defines this ZIP.
Residents contend with environmental concerns related to manufacturing activity, along with wages that lag behind rising living costs.
- Industrial pollution affects livability
- Low wages relative to expenses
- Housing affordability concerns amid stagnant incomes
Urban poverty in these Zip Codes is tied closely to the collapse of Ohio’s industrial base and the slow pace of sustainable redevelopment.
Top ZIP Codes by Lowest Adjusted Gross Income
| ZIP Code | AGI |
|---|---|
| 44510 – Youngstown | $68,760 |
| 45033 – Hooven | $71,450 |
| 45808 – Beaverdam | $72,680 |
| 45650 – Lynx | $75,080 |
| 43321 – Fulton | $84,770 |
| 44507 – Youngstown | $91,850 |
| 45727 – Dexter City | $93,650 |
| 44506 – Youngstown | $94,000 |
| 43217 – Columbus | $94,860 |
| 44490 – Washingtonville | $96,980 |
Analyzing the lowest Adjusted Gross Income (AGI) figures across Ohio Zip Codes reveals a complex mix of urban neighborhoods still struggling after:
- Industrial decline
Rural communities facing agricultural challenges - Small towns with stagnant economies
These areas often share limited access to well-paying jobs, reduced infrastructure investment, and barriers to educational advancement.
44510 – Youngstown: AGI $68,760
Once a center for steel production, this neighborhood in Youngstown has endured decades of economic hardship following the collapse of the steel industry.
Many families now live in homes passed down for generations, but the cost of maintaining older properties often outweighs available income.
Public resources are strained, leaving residents with fewer opportunities to improve their quality of life.
- High unemployment rate and limited job diversity
- Aging housing stock with low property values
- Scarce new business investment or industrial redevelopment
45033 – Hooven: AGI $71,450
Positioned along the Ohio River, Hooven’s economy depends on a small number of local employers, often in manufacturing and river transport.
Job reductions in recent years have forced residents to seek work farther away, leading to higher transportation costs that cut into already modest wages.
- Dependence on a narrow set of industries
- Long commutes to nearby cities for employment
- Minimal public transportation options
45808 – Beaverdam: AGI $72,680
This rural community thrives primarily on agriculture and trucking services, but both sectors are vulnerable to market volatility.
Seasonal work patterns mean that income is not consistent throughout the year, and many residents take on multiple part-time jobs to make ends meet.
- Seasonal employment instability
- Dependence on agriculture, trucking, and related trades
- Limited career advancement opportunities
45650 – Lynx: AGI $75,080
Situated in southern Ohio, Lynx is geographically isolated, with residents facing challenges in accessing healthcare, higher education, and diverse employment options.
Poor broadband connectivity makes remote work difficult, leaving many reliant on low-wage, locally available jobs.
- Geographic isolation increasing travel costs
- Limited internet infrastructure for modern job markets
- Minimal presence of large-scale employers
43321 – Fulton: AGI $84,770
Fulton’s economy is rooted in agriculture, but a lack of industry diversification has led to slower economic growth.
Younger residents often move to larger cities for better opportunities, resulting in an older demographic that contributes less to local economic expansion.
- Dependence on farming and related services
- Ongoing youth outmigration
- Aging population with limited disposable income
44507 – Youngstown: AGI $91,850
Located in the southern part of Youngstown, this ZIP Code struggles with persistently high unemployment and an aging housing market.
While some commercial areas remain active, many buildings sit vacant, reflecting slow economic recovery.
- Underutilized commercial properties
- Property values well below state averages
- Low-wage service industry dominance
45727 – Dexter City: AGI $93,650
A small village with limited economic activity, Dexter City relies heavily on agriculture and trades.
The small population reduces consumer demand, making it challenging for new businesses to succeed.
- Small population limiting local economic growth
- Scarce employment options within the community
- Reliance on seasonal and part-time work
44506 – Youngstown: AGI $94,000
Located close to downtown, this area has suffered from decades of job loss, particularly in manufacturing.
Infrastructure upgrades have been slow, and many residents face barriers to entering higher-paying careers due to educational and skill gaps.
- Persistent poverty despite central location
- Delayed infrastructure and service improvements
- Lack of targeted workforce development programs
43217 – Columbus: AGI $94,860

This industrial zone in south Columbus provides employment in warehousing and manufacturing, but most jobs offer modest pay without strong benefits.
Rising housing and living costs in the broader metro area create added financial strain.
- Wage stagnation in industrial sectors
- High commuting costs for workers living outside the immediate area
- Limited affordable housing near job sites
44490 – Washingtonville: AGI $96,980
Washingtonville’s economy revolves around agriculture and small local businesses.
Wage growth has been slow for years, and many residents work in industries with minimal opportunities for advancement.
- Reliance on farming and small-scale commerce
- Lack of major employers in the area
- Incomes not keeping pace with inflation
Low AGI figures in these Zip Codes reflect more than just wage issues; they point to structural challenges, including limited economic diversification, low investment in local economies, and barriers to higher education and skill development.
Ohio Income Profile Overview
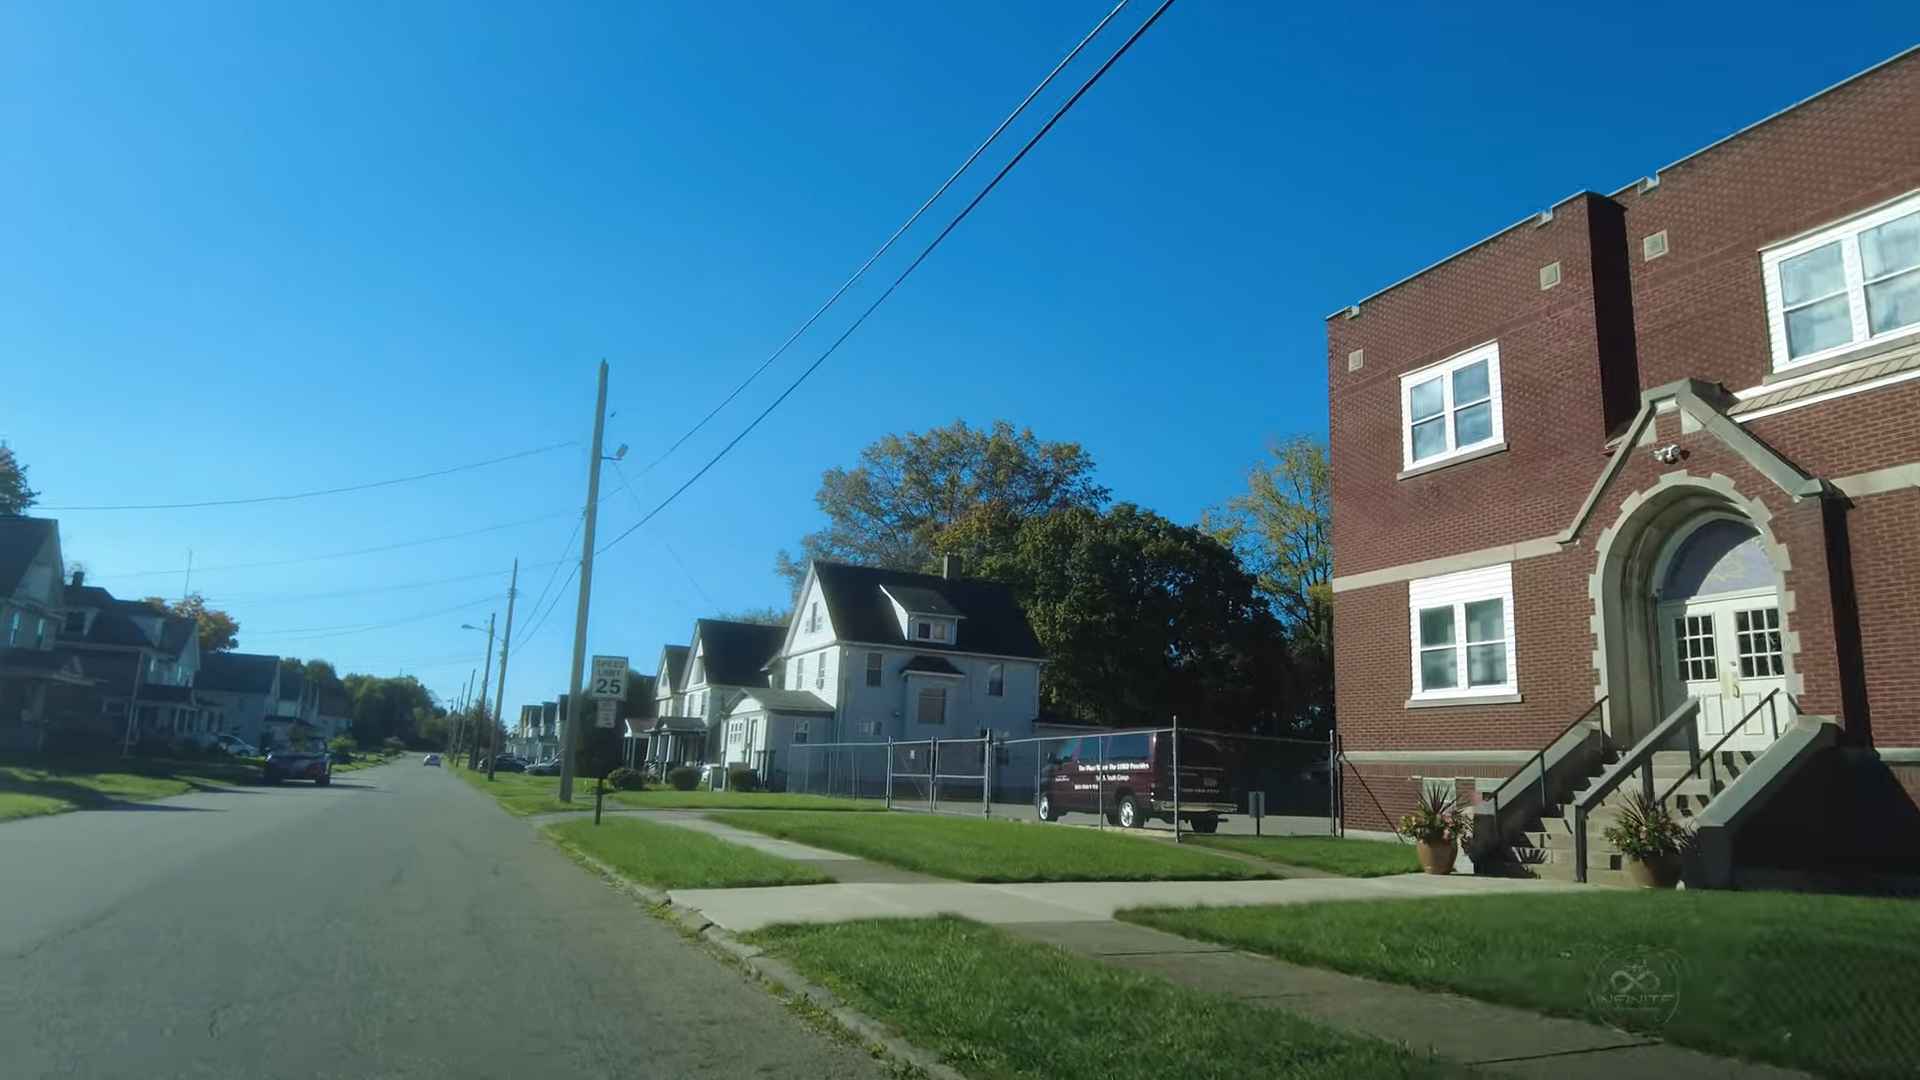
Ohio’s income distribution paints a complex picture of prosperity and poverty existing side by side.
While some communities thrive economically, others experience severe financial strain, often within the same metropolitan area.
According to DataUSA, the state’s median household income is $69,680, which falls below the national median of $78,538. The average household income sits at $94,766, also trailing the US average of $110,491.
Per capita income in Ohio reaches $39,455, showing that individual earning power remains modest compared to national figures.
The gap between the highest and lowest earning Zip Codes is striking, revealing not just economic inequality, but also the influence of local industries, access to education, and regional cost of living.
Some neighborhoods in Youngstown report household incomes under $20,000, while affluent areas like Indian Hill can surpass $290,000.
The range underscores the vastly different financial realities residents experience depending on location.
- Location-based disparities – Urban cores hit by industrial decline report far lower incomes than suburban or exurban communities benefiting from professional and tech-sector growth.
- Occupational differences – Areas with a concentration of service and retail work average lower wages than those anchored by finance, healthcare, and engineering jobs.
- Educational attainment – Zip Codes with higher percentages of college graduates tend to post stronger income figures across all age groups.
- Demographics and age – Younger workers and retirees generally earn less than middle-aged professionals in their peak earning years.

Regional Trends & Observations
Patterns in Ohio’s poorest Zip Codes reveal that economic hardship is shaped by both location and historical development.
Urban poverty is heavily concentrated in central neighborhoods of major cities, including:
- Cincinnati
- Cleveland
- Toledo
- Youngstown
These areas have experienced sustained decline following the loss of manufacturing jobs that once formed the economic backbone of the region. In many cases, redevelopment efforts have been uneven, benefiting select areas while leaving others untouched.
Rural communities such as Lynx, Fulton, and Dexter City face equally significant economic struggles, though their challenges differ. Isolation, limited public services, and aging infrastructure restrict growth potential.
With fewer employers and long distances to major job centers, residents often rely on seasonal or part-time work to get by.
Certain Zip Codes near universities, such as 43201 in Columbus, present another type of poverty profile. Student-heavy populations have low reported incomes due to part-time work or lack of employment while in school.
Unlike other low-income areas, the long-term outlook here is often more positive because many residents move into higher-paying careers after graduation.
- High poverty linked to industrial job losses, aging housing, and underfunded public services.
- Limited infrastructure, fewer employers, and restricted access to healthcare and education.
- Statistically low incomes influenced by student demographics, not necessarily long-term economic decline.
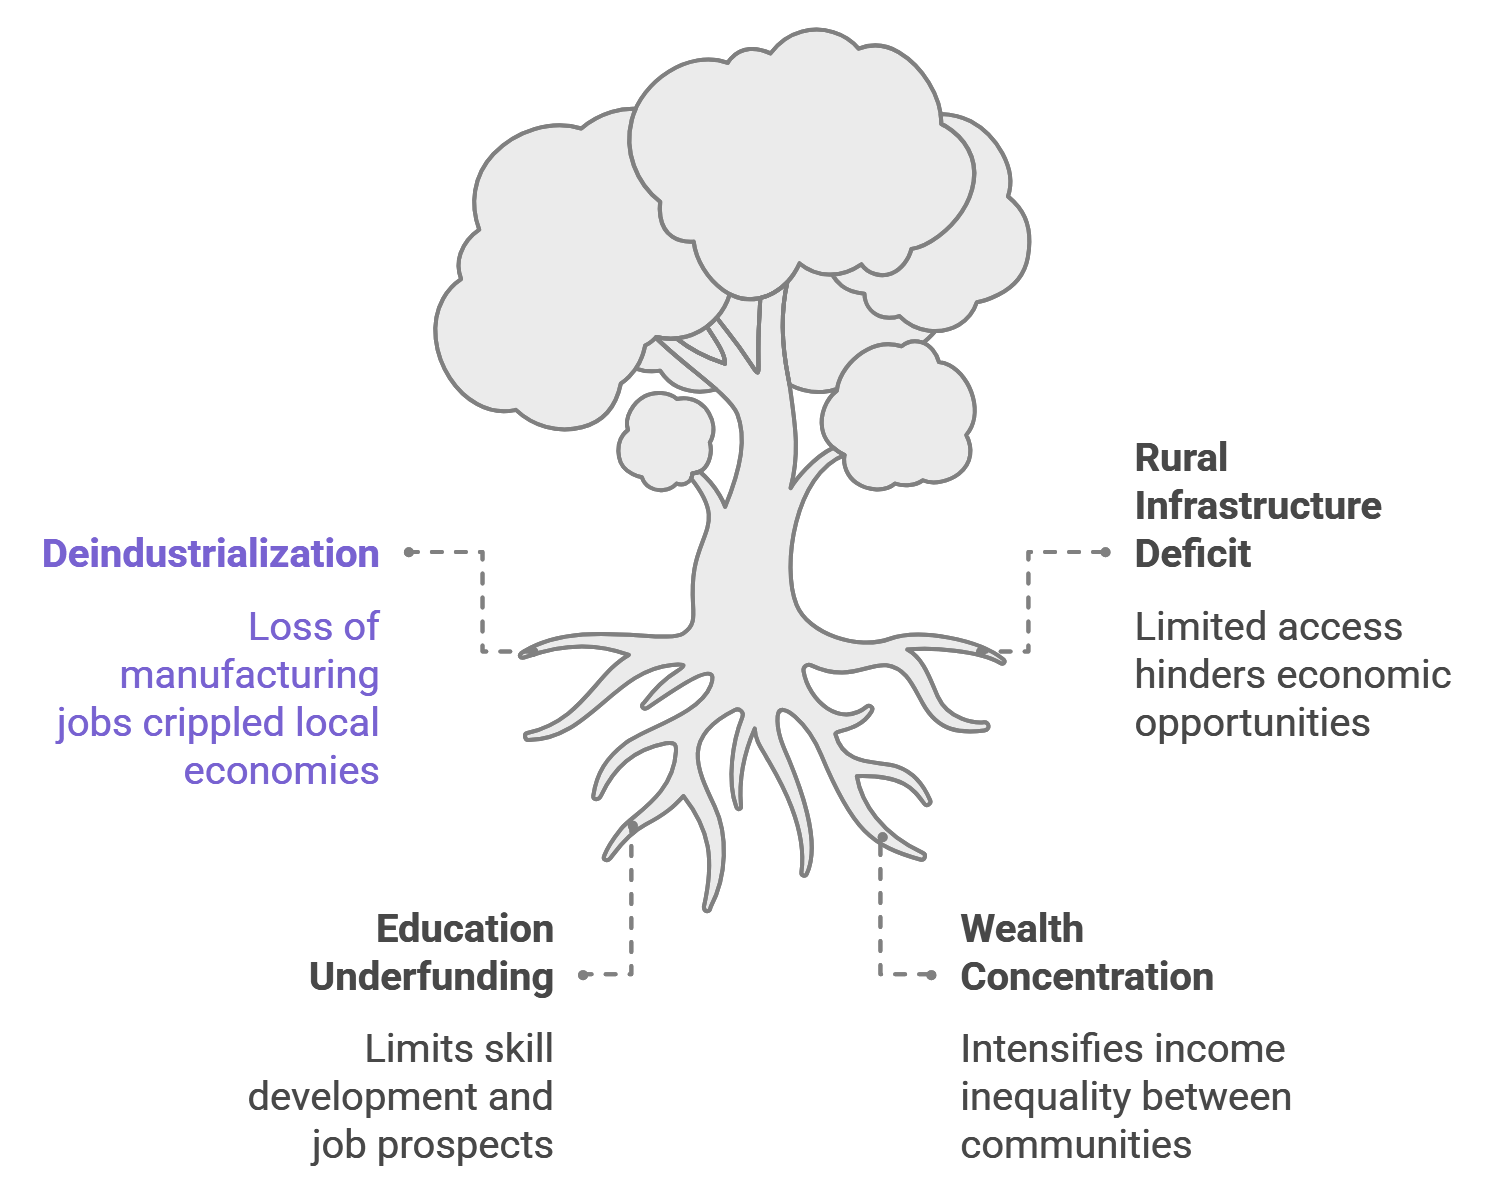
Root Causes and Contributing Factors
Several underlying factors consistently appear in . A major driver is deindustrialization, which removed thousands of stable, well-paying jobs from cities across the state.
The manufacturing collapse left behind high unemployment and weakened local economies, with many areas struggling to replace these lost industries.
In rural communities, lack of infrastructure and insufficient investment remain major barriers to economic growth. Poor road conditions, limited broadband access, and inadequate public transportation make it harder to attract new businesses or allow residents to commute for work.
Education quality also plays a critical role. Underfunded schools in low-income areas limit skill development, restricting residents’ ability to compete for higher-paying jobs.
Another contributing factor is wealth concentration in a small number of affluent suburbs, which intensifies the income gap between communities.
- Permanent loss of manufacturing jobs and related economic activity.
- Rural areas with poor transportation, limited internet access, and outdated utilities.
- Underfunded schools that reduce long-term earning potential.
- Affluent suburbs pulling resources away from lower-income communities.
- Economic hardship passed down without significant opportunity for change.
Methodology
A comprehensive approach was used to evaluate Ohio’s poorest Zip Codes. Three main metrics shaped the analysis.
Poverty rate measures the proportion of residents living below the federal poverty line. Adjusted Gross Income (AGI) reflects taxable income after deductions, providing a realistic picture of earnings.
Median household income offers a midpoint value, showing the standard of living for the average household.
Only Zip Codes with reliable Census data and a significant population size were included. This ensured results were statistically relevant and representative of both urban neighborhoods and rural towns.
Summary
Economic disparities in Ohio are evident when comparing Zip Codes across the state. Both urban centers and isolated rural towns contain areas of severe poverty, highlighting the need for comprehensive strategies to address economic inequality.
Communities such as 45204 in Cincinnati, 44115 in Cleveland, and 44510 in Youngstown represent some of the hardest-hit locations.
Identifying and understanding these areas is a step toward creating targeted policies that can lead to more equitable opportunities for all Ohio residents.